Sunday, December 30, 2012

Pstricks custom graphic objects

Pstricks contains a large number of graphics object, but sometimes they are not enough, and you need something very special. This can be realized using command "\pscustom[prameters]{commands}".

Consider this problem. We would like to draw a ribbon like this:
Of course, properly using the line, polygon or curve commands, we can draw it. But I would say "\pscustom" will make the task very simple. Carefully examine the graph, we find that it is something enclosed by two sine curve. So can we draw such a graph object by simply plotting two sine curve? Let us have a try.

\documentclass{article}
\usepackage{pstricks}
\usepackage{pst-plot}
\begin{document}
  \begin{pspicture}*(-1,-1.5)(7,1.5)
  \psgrid
    \psset{xunit=0.015cm}
    \psplot{0}{360}{x sin 0.25 sub}
    \psline(360,0.25)(360,-0.25)
    \psplot{360}{0}{x sin 0.25 add}
    \psline(0,-0.25)(0,0.25)
  \end{pspicture}
\end{document} 

Fig.1 Custom graphic objects --- preparation

We have successfully draw two sine curves and two lines to join them togethre. The problem is how to fill the area enclosed by the two curve. This is where "\pscustom" steps in. Try the following codes (which is very simillar to the upper ones, except that the lines are enclosed in "\pscustom" command and fill parameters is set.)

\documentclass{article}
\usepackage{pstricks}
\usepackage{pst-plot}
\begin{document}
  \begin{pspicture}*(-1,-1.5)(7,1.5)
    \psset{xunit=0.015cm}
    \pscustom[fillstyle=solid,fillcolor=red]
    {
      \psplot{0}{360}{x sin 0.25 sub}
      \psline(360,0.25)(360,-0.25)
      \psplot{360}{0}{x sin 0.25 add}
      \psline(0,-0.25)(0,0.25)
    }
  \end{pspicture}
\end{document}

Fig.2 Custom graphic objects --- ribbon

And you get a graph just like what you asked to draw. Now we have successfully creat the ribbon object. You may have a try by using line or curve command to finish the same task, and compare which method is simpler.

"Practice makes perfect", one more example will be shown.

\documentclass{article}
\usepackage{pstricks}
\usepackage{pst-plot}
\begin{document}
  \begin{pspicture}*(-3.5,-3.5)(3.5,3.5)
    \pscustom[fillstyle=solid,fillcolor=red,
      linestyle=none]
    {
      \psplot{-1.414}{1.414}{2 x 2 exp sub}
      \psplot{-1.414}{1.414}{-2 x 2 exp add}
    }
    \psset{linewidth=2pt,linecolor=blue}
    \psplot{-3}{3}{2 x 2 exp sub}
    \psplot{-3}{3}{-2 x 2 exp add}
    \psset{linecolor=black}
    \psaxes{->}(0,0)(-3.5,-3.5)(3.5,3.5)
  \end{pspicture}
\end{document}

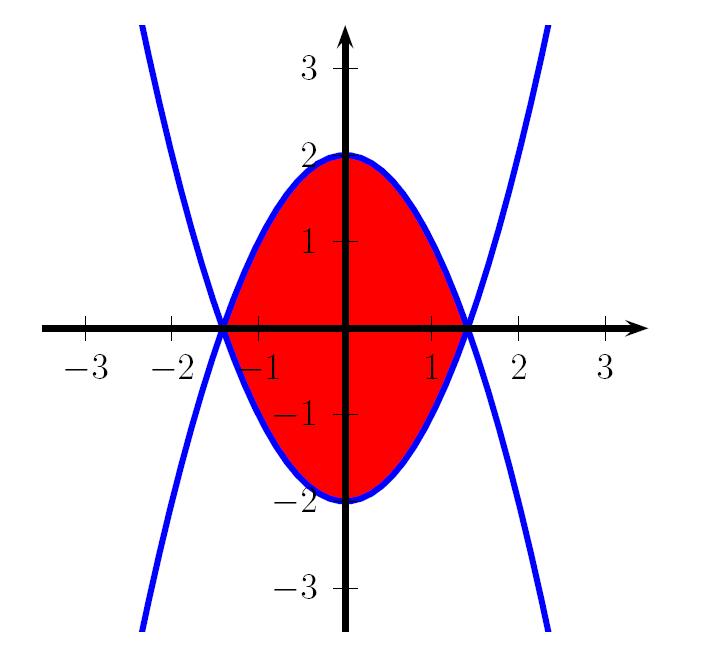
Fig.3 Custom graphic objects --- filled curves
Files Download: tex ps pdf

Friday, November 30, 2012

Deal with repetitive work in pstricks efficiently (2) --- multido

Last time we talked about doing repetitive work in postricks using command "\multirput", and this time "\multido" will be introduced. "\multido" is a much more general loop macro than "\multirput". You can use it like this "\multido {\loop_indication = start_value + increment} {loop_nums} {loop_content}", very simillar to loop in programming language. Some examples are shown below.

\documentclass{article}
\usepackage{multido}
\usepackage{pstricks}

\begin{document}
  \begin{pspicture}*(-0.5,0.5)(5.5,5.5)
    \multido{\ix=0+1}{6}
    {
      \multido{\iy=0+1}{6}
      {
        \rput(\ix,\iy){(\ix,\iy)}
      }
    }
  \end{pspicture}
\end{document}

Fig.1 Deal with repetitive work in efficiently (2) --- multido

Files Download: tex ps pdf

\documentclass{article}
\usepackage{multido}
\usepackage{pstricks}

\begin{document}
  \begin{pspicture}(2,2)
    \pscircle*[linecolor=yellow](1,1){0.707}
    \psset{linecolor=red}
    \multido{\ix=0+15}{24}
    {
      \rput{\ix}(1,1){\psline(0.5,0.5)(1,1)}
    }
  \end{pspicture}
\end{document}

Fig.2 Deal with repetitive work in efficiently (2) --- multido

Files Download: tex ps pdf

Wednesday, October 31, 2012

Deal with repetitive work in pstricks efficiently (1) --- multirput

Computer makes the repetitive work simple. And in pstricks command "\multirput" and "\multido" is designed to deal with the repetitive work.
This time we will talk about command "\multirput", and in the next post "\multido" will also be talked.

"\multirput" as its literal meaning, archive the utility of multi "\rput" commands. The complete form of this command is "\multirput [refpoint] {rotation} (x0,y0) (dx,dy) {nums} {stuff}". The argument "refpoint", "rotation" and "stuff" have the same meaning as the corresponding arguments in command "\rput". (x0,y0) is the starting rput position and (dx,dy) is the increasement, and "nums" is the repetation times. In the following example we use this command to create a simple geometry pattern.

\documentclass{article}
\usepackage{pst-plot}
\usepackage{pstricks}
\begin{document}
  \begin{pspicture}(0,0)(8,5) 
    %horizontal loop
    \multirput[bl](0,0)(1,0){5}
    {
      %vertical loop
      \multirput[bl](0,0)(0.5,0.866){5} 
      {
        \psline(0,0)(1,0)(0.5,0.866)(0,0)
        %Draw a equilateral triangle
      }
    }
    \psline(2.5,4.33)(7.5,4.33) %top line
    \psline(7.5,4.33)(5,0) %right line
  \end{pspicture}
\end{document}

Fig.1 Deal with repetitive work in efficiently (1) --- multirput

Files Download: tex ps pdf

Wednesday, September 12, 2012

rput --- a most offen used pstricks command

"rput" is a most offen used pstricks command. It gives you the ability to place and rotate whatever you want. We have used this command before, and this time we come to examine it carefully.
The common useage of this command is "\rput[refpoint]{rotation}(x,y){stuff}".
"refpoints" determines the reference point of stuff. It take value of the combination of "t,b,B"(for vertical refpoint, means "top","bottom" and "Baseline" respectively) and "l,r"(for horizontal refpoint, means "left" and "right" respectively).

"rotation" is the angle "stuff" will be rotated. "(x,y)" is the position where "stuff" will be placed. And "stuff" is what you want to place at position (x,y), for example, some words, some pstricks element and so on. Note that the coordinates appear in "stuff" are coordinates relative to (x,y).

In the following example the usage of this command is shown practically.

\documentclass{article}
\usepackage{pst-plot}
\usepackage{pstricks}
\begin{document}
  \begin{pspicture}(0,0)(5,5)
  \psgrid[gridcolor=gray,
    subgridcolor=lightgray](0,0)(5,5)
  \rput[bl](0,1){bottom left (0,1)}
  \rput[tr](5,1){top right (5,1)}
  \rput[Bl](0,2){Baseline left (0,2)}
  \rput{45}(1,4){rotate $45^{\circ}$}
  \rput{45}(3.5,3.5)
  {
    \psframe[linecolor=red](-1,-1)(1,1)
  }
  \end{pspicture}
\end{document}

Fig.1 rput --- a most offen used pstricks command
Files Download: tex ps pdf

Thursday, July 5, 2012

Pie Chart --- Optional arguments of "\psChart"

Now we come to examine the optional arguments of command "\psChart". The following table lists the special options belong to "\psChart".

name description default value
chartSep distance from the pie chart center to an outraged pie piece 10pt
chartColor gray or color gray
usercolor a comma separated list of user defined colors for the pie pieces encloed with { } { }
chartNodeI the position of the inner node, relative to the radius 0.75
chartNodeO the position of the outer node, relative to the radius 1.5

With these arguments we can plot a outstanding pie chart.

\documentclass{article}
\usepackage{pstricks}
\usepackage{pstricks-add}
\usepackage{pst-plot}
\begin{document}
\begin{figure}
\centering
  \begin{pspicture}(-5,-5)(8,5)
    %Pie chart
    \psChart[chartSep=15pt,chartColor=color,
             chartNodeO=1.15,shadow=true,
             shadowsize=5pt]{15,20,30,20,15}
             {3}{4.75}
    %The Label for the outraged piece
    \ncline[linecolor=-chartFillColor3]
            {psChartI3}{psChartO3}
    \uput[l](psChartO3){\textcolor{chartFillColor3}
                        {\large The Most}
                       }
    %The legends
    \psframe[fillcolor=chartFillColor1,fillstyle=solid]
             (5.25,-5)(6.5,-4.5)
    \uput[r](6.5,-4.75){Traffic}
    \psframe[fillcolor=chartFillColor2,fillstyle=solid]
             (5.25,-4)(6.5,-3.5)
    \uput[r](6.5,-3.75){Clothes}
    \psframe[fillcolor=chartFillColor3,fillstyle=solid]
             (5.25,-3)(6.5,-2.5)
    \uput[r](6.5,-2.75){Food}
    \psframe[fillcolor=chartFillColor4,fillstyle=solid]
             (5.25,-2)(6.5,-1.5)
    \uput[r](6.5,-1.75){Rent}
    \psframe[fillcolor=chartFillColor5,fillstyle=solid]
             (5.25,-1)(6.5,-0.5)
    \uput[r](6.5,-0.75){Others}
  \end{pspicture}
\end{document}

Fig.1 An advanced practical example of pie chart plotting

Files downloads: tex ps pdf


Saturday, June 9, 2012

Pie Chart --- three useful nodes defined by command "\psChart"

The macro \psChart defines for every value three nodes at the half angle and in distances from chartNodeI (default 0.75), 1 and chartNodeO(default 1.25) times of the radius from the origin (chartNodeI and chartNodeO will be discussed in the next post). The nodes are named as psChartInum, psChartnum and psChartOnum, where num is the number of the pie pieces (num have a value between 1 to the numbers of pie pieces, Letter I stands for Inner and O stands for Outer). These nodes will be very usefull when you add labels to the pie pieces. The following shows these nodes visually.

\documentclass{article}
\usepackage{pstricks}
\usepackage{pstricks-add}
\usepackage{pst-plot}
\begin{document}
  \begin{pspicture}(-5,-5)(5,5)
    \psChart{2,2,3,2}{}{3}
    \psdot[linecolor=red](psChart2)
    \uput[r](psChart2){\textcolor{red}{psChart2}}
    \psdot[linecolor=green](psChartI2)
    \uput[r](psChartI2){\textcolor{green}{psChartI2}}
    \psdot[linecolor=blue](psChartO2)
    \uput[r](psChartO2){\textcolor{blue}{psChartO2}}
    \psdot[linecolor=red](psChart3)
    \uput[r](psChart3){\textcolor{red}{psChart3}}
    \psdot[linecolor=green](psChartI3)
    \uput[r](psChartI3){\textcolor{green}{psChartI3}}
    \psdot[linecolor=blue](psChartO3)
    \uput[r](psChartO3){\textcolor{blue}{psChartO3}}
  \end{pspicture}
\end{document}

Fig.1 Three useful nodes defined by command \psChart.

Files Downloads: tex ps pdf

Now a practical example of plotting a pie chart will be presented.

\documentclass{article}
\usepackage{pstricks}
\usepackage{pstricks-add}
\usepackage{pst-plot}
\begin{document}
  \begin{pspicture}(-5,-5)(5,5)
    \psChart{5,4,4,3,3}{}{3}
    \rput(psChartI1){\textcolor{red}{5}}
    \rput(psChartI2){\textcolor{red}{4}}
    \rput(psChartI3){\textcolor{red}{4}}
    \rput(psChartI4){\textcolor{red}{3}}
    \rput(psChartI5){\textcolor{red}{3}}
    \psset{nodesepA=5pt,nodesepB=-10pt}
    \rput(psChartO1){{US}}
    \rput(psChartO2){{EU}}
    \rput(psChartO3){{China}}
    \rput(psChartO4){{Japan}}
    \rput(psChartO5){{Others}}
  \end{pspicture}
\end{document}

Fig.2 A practical example of pie chart plotting.

In this example, we put the labels using the nodes which have been defined by "\psChart".

Files Downloads: tex ps pdf

Sunday, June 3, 2012

Pie chart --- the simplest use of command "\psChart"

Command "\psChart" in package pstricks-add makes plot a pie chart very simple. The syntax of this command is "\psChart[options]{values1}{values2}{radius}". "values1" is the list of date to be plotted. "vaules2" is a list of outraged pieces. For example, if you want the 1st and 5-th sector to be outraged, you can specify this parameter as "{1,5}". "radius" is the radius of the pie chart. The color used to paint the num-th pie piece is named internally as "chartFillColornum".

Now let us have a try of this command.

  \begin{pspicture}(-5,-5)(8,5)
    %Pie chart
    \psChart{1,2,2,3,1,4}{1,5}{4.75}
    %The legends
    \psframe[fillcolor=chartFillColor1,
      fillstyle=solid](5.25,-5)(6.5,-4.5)
    \uput[r](6.5,-4.75){Pie 1}
    \psframe[fillcolor=chartFillColor2,
      fillstyle=solid](5.25,-4)(6.5,-3.5)
    \uput[r](6.5,-3.75){Pie 2}
    \psframe[fillcolor=chartFillColor3,
      fillstyle=solid](5.25,-3)(6.5,-2.5)
    \uput[r](6.5,-2.75){Pie 3}
    \psframe[fillcolor=chartFillColor4,
      fillstyle=solid](5.25,-2)(6.5,-1.5)
    \uput[r](6.5,-1.75){Pie 4}
    \psframe[fillcolor=chartFillColor5,
      fillstyle=solid](5.25,-1)(6.5,-0.5)
    \uput[r](6.5,-0.75){Pie 5}
    \psframe[fillcolor=chartFillColor6,
      fillstyle=solid](5.25,0)(6.5,0.5)
    \uput[r](6.5,0.25){Pie 6}
  \end{pspicture}

Fig.1 Pie chart plots in Pstricks

In the upper example, we see that a pie chart with radius "5" is plotted accroding to data "{1,2,2,3,1,4}", and the 1-st and 5-th pie pieces is outraged. This is exactly what we expected. And with the help of variable "chartFillColornum" we produced the legends.

Files Downloads: tex ps pdf
Creative Commons License
Except as otherwise noted, the content of this page is licensed under a Creative Commons Attribution-NonCommercial-NoDerivs 3.0 Unported License.